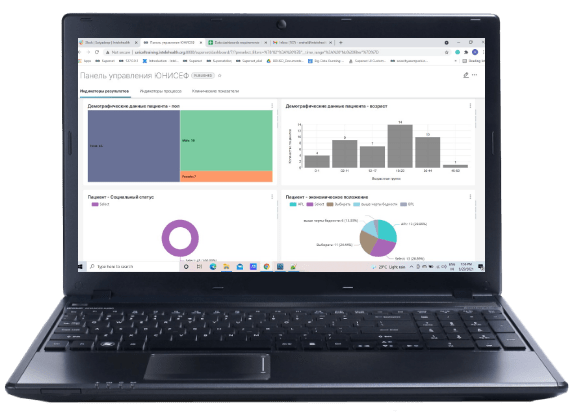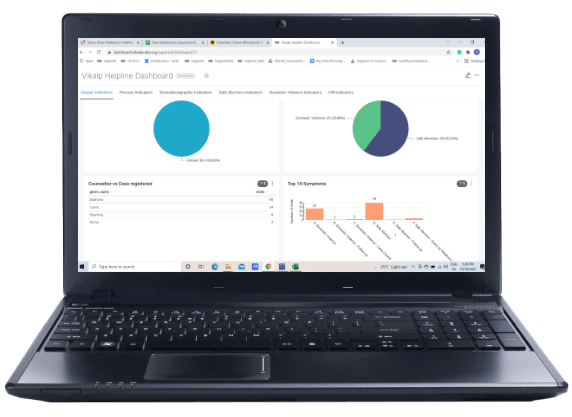

Our data analytics services provide a complete end to end solution for monitoring & evaluating the overall performance of the project. It provides a transparent and evidence based reporting to measure the progress of a partner's interventions continuously and consistently. The visualizations created in the dashboard helps us to share the results with all our stakeholders and donors at every stage of the project cycle. The various charts and graph narratives and images created by Intelehealth enhance the impact of the project reporting.

Data dashboards are an information management tool that is used to track KPIs, metrics, and other key data points relevant to the organization. They simplify complex data sets to provide users with at a glance awareness of current performance. At Intelehealth, we have implemented an open source “Apache Superset” BI tool to design dashboards. For each program implementation, carried out by the Intelehealth, we provide a dashboard which shall empower the users to: 1. Get real time data insights 2. Ability to perform data analysis over a specific time period 3. Identify areas that require urgent actions 4. Take necessary actions to streamline workflows and utilize resources effectively


During the first lockdown, patients with chronic illness with mental conditions, diabetes, and blood pressure were unable to procure medications due to invalid prescriptions. During that time, eSanjeevani was launched, and I managed to consult 15-20 patients. This was a life-saving platform for people. I applaud the flawless work done by everyone involved in launching eSanjeevani. I feel satisfied treating people those in need and serving them with the best of my abilities.